KGDI–RTF
Investment Presentation
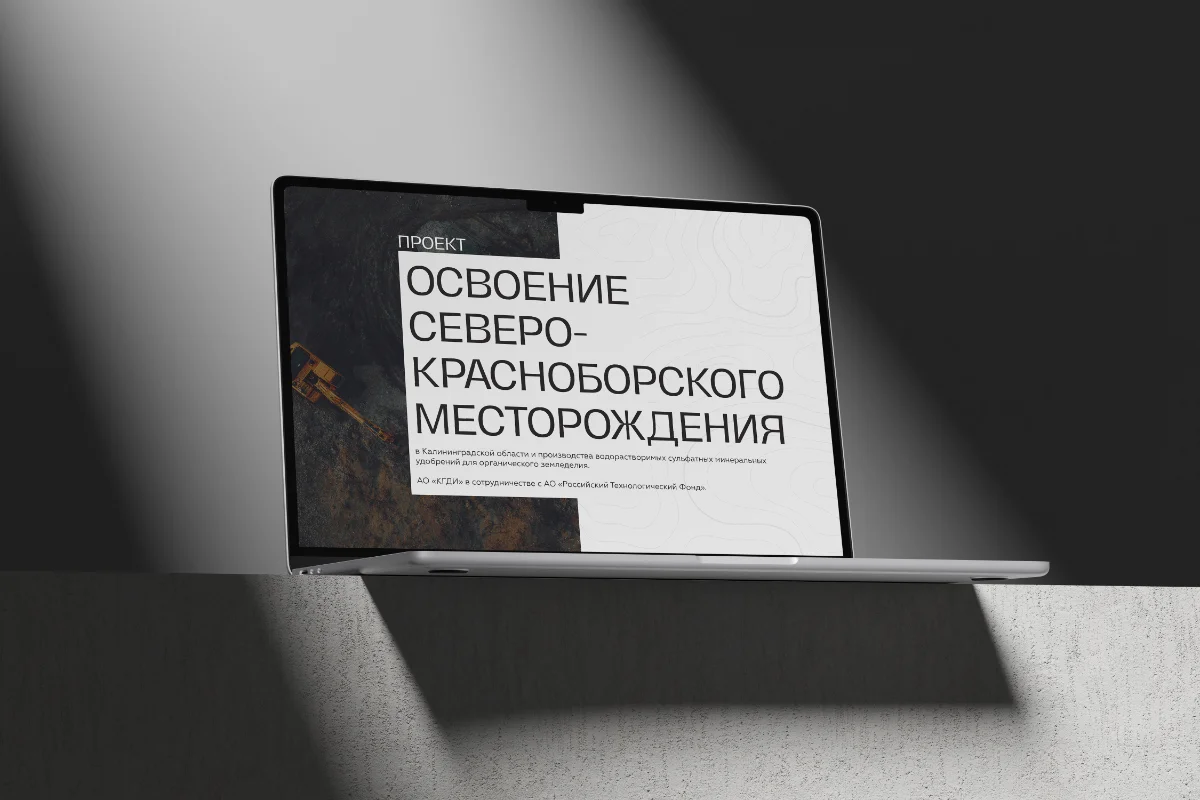
KGDI–RTF is a joint venture between KGDI and the Russian Technology Foundation, set up to develop the Severo-Krasnoborsky polygalite deposit in Kaliningrad — among the ten largest reserves of its kind worldwide — and to build out production of water-soluble mineral fertilizers for organic farming.
The existing materials — years of licenses, geological surveys, and financial modeling — only existed as dense, unbranded slides, a mismatch for a project positioned as strategically important to Russia’s organic agriculture sector. Beyond the missing visual identity, the deeper problem was density without hierarchy: every page carried legal context, geology, and financials all at once, with nothing signaling which numbers actually mattered or how the argument was meant to build from one slide to the next. The brief was to give the material a form serious enough for a 20-year industrial license and legible enough for an investor to follow without a guide.
I led the presentation design in full — restructuring the content, building the data visualization system, and designing every slide from the client’s source material.
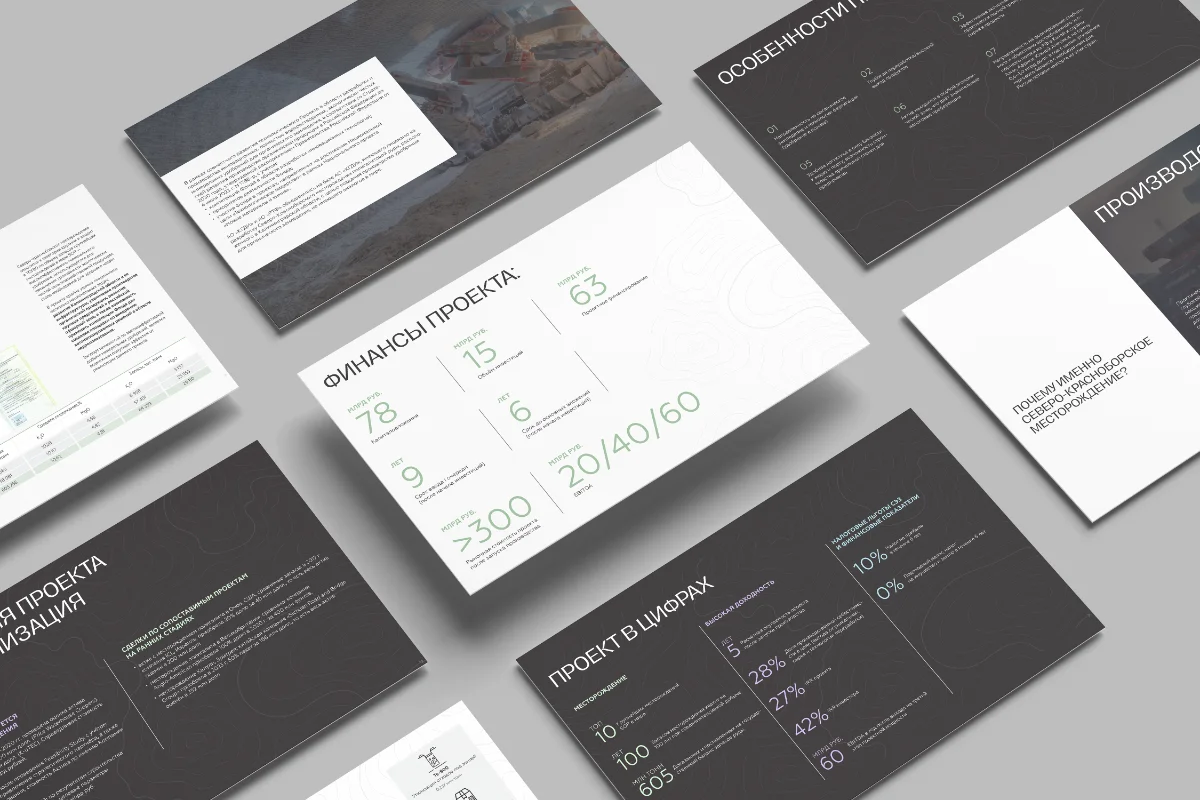
The register we landed on was specific: clean, serious, and technological — nothing that reads like a startup pitch, because the audience was institutional and technical investors weighing a 20-year license. So the deck leads with credibility signals — the deposit’s Top-10-in-the-world ranking, the government strategy it supports, the staged EBITDA rollout across three phases (20/40/60 billion rubles) — each given its own slide instead of competing for space. Dense legal and geological material was split, reordered, and paired with diagrams so the argument moves in one direction: what this is, why it’s credible, what it returns.
01Understanding the brief — the client wanted a clean, serious, technological presentation, not a startup pitch, built for institutional and technical investors evaluating a 20-year industrial license.
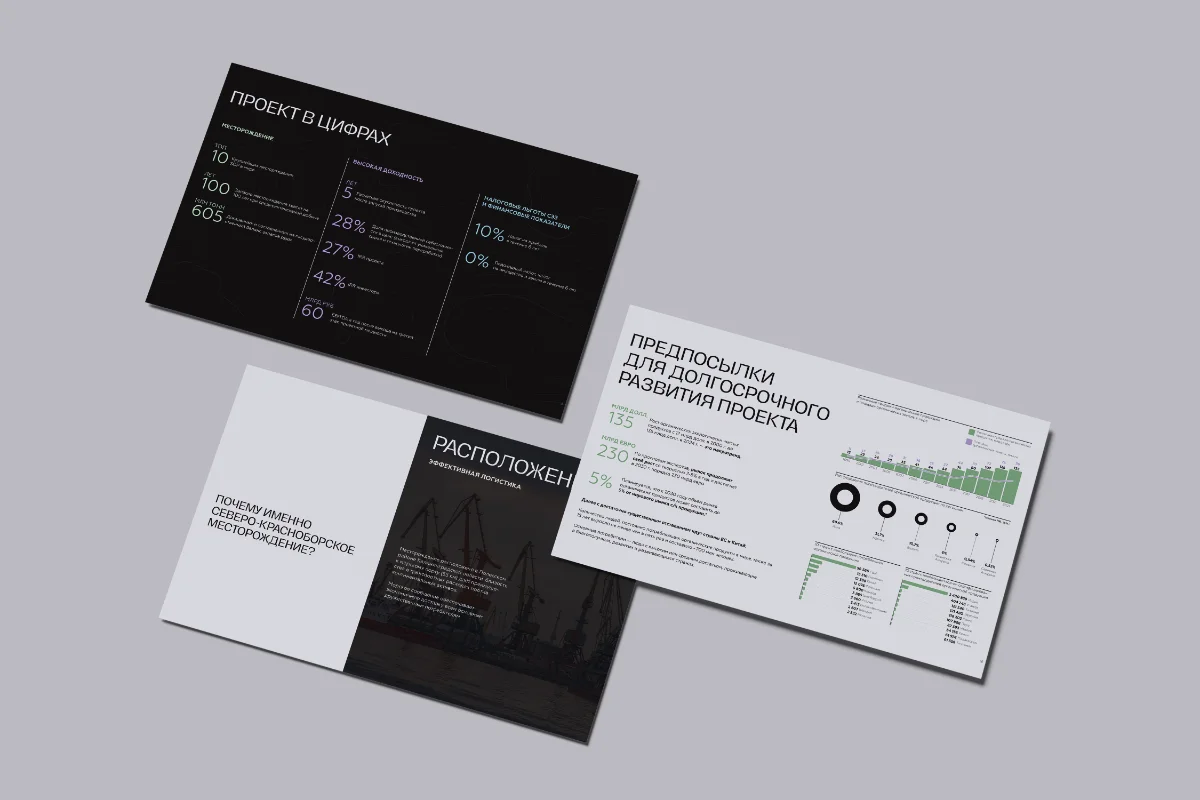
02Breaking down density — split overloaded slides into focused ones and reordered sections so the argument moves logically from credibility to economics to outlook.
03Visual hierarchy for credibility — pulled key numbers out and gave them their own visual weight instead of letting them compete with surrounding text.
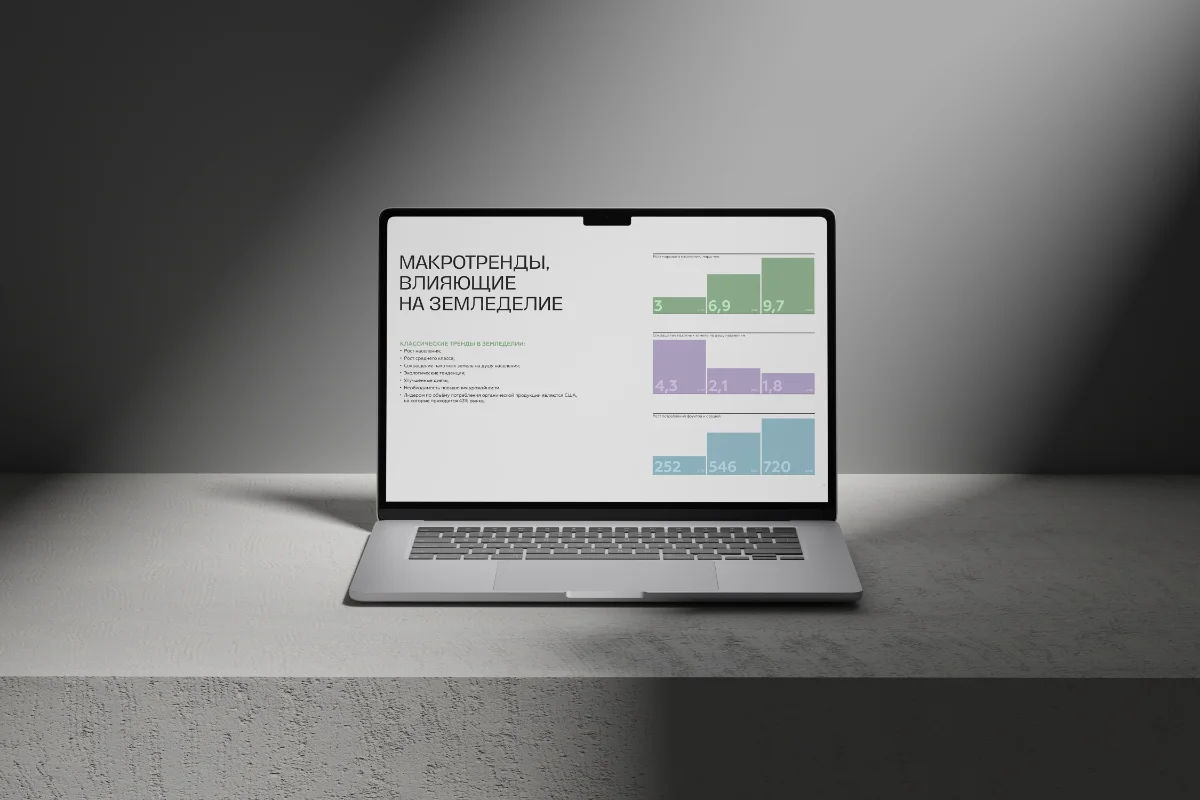
04Data visualization — turned raw production and financial data into diagrams and charts, including a full mass-balance flow diagram of the extraction process.
05Iterative refinement — the deck went through several rounds of granular, slide-by-slide feedback before reaching its final form.